Grid traversal
Create a few test cells to the examples on this page:
import numpy as np
import h3.api.numpy_int as h3
import pandas as pd
import pyarrow as pa

from h3ronpy.pandas.vector import cells_dataframe_to_geodataframe
from h3ronpy import DEFAULT_CELL_COLUMN_NAME

cells = np.array(
    [
        h3.geo_to_h3(5.2, -5.2, 7),
        h3.geo_to_h3(5.3, -5.1, 7),
    ],
    dtype=np.uint64,
)
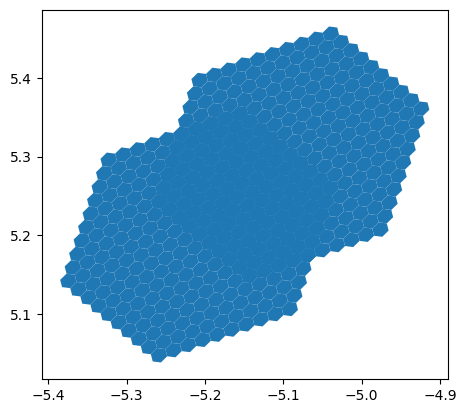
Grid-disks with h3ronpy.grid_disk()
from h3ronpy import grid_disk

cells_dataframe_to_geodataframe(
    pd.DataFrame({
        DEFAULT_CELL_COLUMN_NAME: pa.array(grid_disk(cells, 9, flatten=True)).to_pandas()}
    )
).plot()
<Axes: >
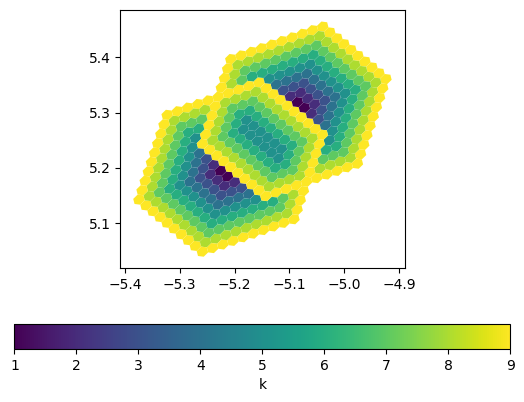
Grid-disk aggregates with h3ronpy.grid_disk_aggregate_k()
This builds ontop of h3ronpy.grid_disk_distances() while directly
performing simple aggregations to avoid returning potentially very large dataframes.
from h3ronpy import grid_disk_aggregate_k

cells_dataframe_to_geodataframe(
    pa.table(grid_disk_aggregate_k(cells, 9, "min")).to_pandas()
).plot(column="k", legend=True, legend_kwds={"label": "k", "orientation": "horizontal"},)
<Axes: >
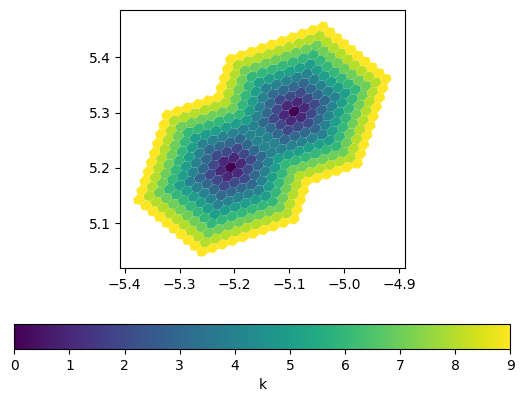
cells_dataframe_to_geodataframe(
    pa.table(grid_disk_aggregate_k(cells, 9, "max")).to_pandas()
).plot(column="k", legend=True, legend_kwds={"label": "k", "orientation": "horizontal"},)
<Axes: >