Converting raster data to H3
from matplotlib import pyplot
import rasterio
from rasterio.plot import show
import numpy as np
import h3.api.numpy_int as h3
from scipy import ndimage
import geopandas as gpd
from pathlib import Path
import os

# increase the plot size
pyplot.rcParams['figure.dpi'] = 120

project_root = Path(os.environ["PROJECT_ROOT"])
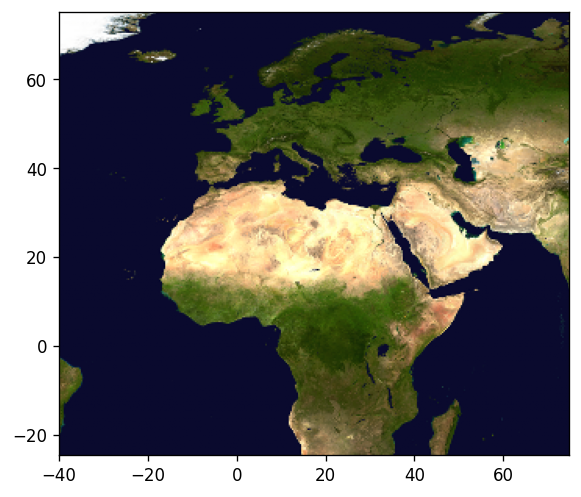
Prepare a dataset using rasterio first
import rasterio
from rasterio.plot import show

src = rasterio.open(project_root / "data/europe-and-north-africa.tif")
print(src.colorinterp)

green = src.read(2)
blue = src.read(3)
print(green.shape)

show(src)
(<ColorInterp.red: 3>, <ColorInterp.green: 4>, <ColorInterp.blue: 5>)
(284, 327)
<Axes: >
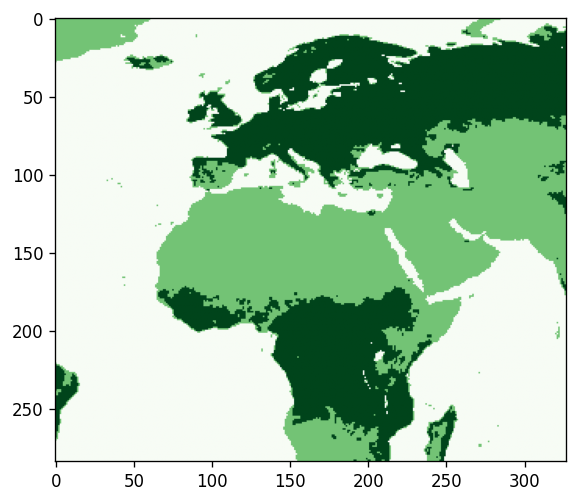
Do some image processing - like this messy extraction of a vegetation mask here:
vegetation_mask = (green < 250) & (blue < 50)
ocean_mask = (green >= 6) & (green <= 14) & (blue >= 47) & (blue <= 54)
vegetation_nodata_value = 0

vegetation = np.full(green.shape, 10, dtype="int8")
vegetation[ocean_mask] = vegetation_nodata_value
vegetation[vegetation_mask] = 20

# smooth a bit to remove single pixels
vegetation = ndimage.gaussian_filter(vegetation, sigma=.7)
vegetation[vegetation <= 5] = vegetation_nodata_value
vegetation[(vegetation > 0) & (vegetation < 15)] = 1
vegetation[vegetation >= 15] = 2
vegetation[ocean_mask] = vegetation_nodata_value

vegetation_plot_args = dict(cmap='Greens', vmin=0, vmax=2)

pyplot.imshow(vegetation, **vegetation_plot_args)
<matplotlib.image.AxesImage at 0x7adf60a40910>
vegetation
array([[1, 1, 1, ..., 0, 0, 0],
       [1, 1, 1, ..., 0, 0, 0],
       [1, 1, 1, ..., 0, 0, 0],
       ...,
       [0, 0, 0, ..., 0, 0, 0],
       [0, 0, 0, ..., 0, 0, 0],
       [0, 0, 0, ..., 0, 0, 0]], shape=(284, 327), dtype=int8)
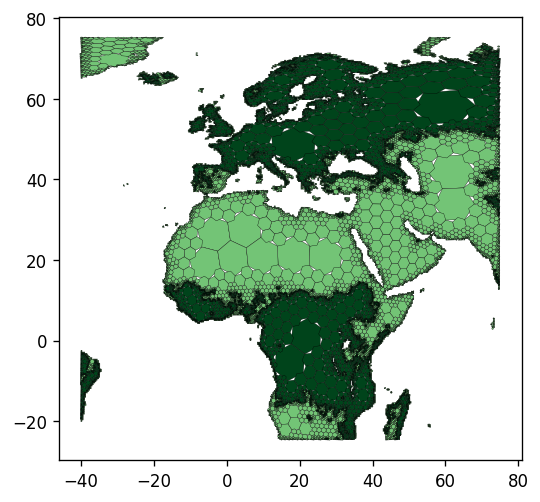
Convert the raster numpy array to H3
Find the closest H3 resolution to use. See also the docstrings of the used functions and of the h3ronpy.raster module.
from h3ronpy.raster import nearest_h3_resolution

h3_res = nearest_h3_resolution(vegetation.shape, src.transform, search_mode="smaller_than_pixel")
print(f"Using H3 resolution {h3_res}")
Using H3 resolution 5
Now we convert the raster directly into a geopandas GeoDataFrame:
from h3ronpy.pandas.raster import raster_to_dataframe

vegetation_h3_df = raster_to_dataframe(
    vegetation,
    src.transform,
    h3_res,
    nodata_value=vegetation_nodata_value,
    compact=True,
    geo=True
)

vegetation_h3_df.plot(column="value", linewidth=0.2, edgecolor="black", **vegetation_plot_args)
pyplot.show()
Converting H3 cells to raster
import pandas as pd
import pyarrow as pa
from h3ronpy.pandas.raster import rasterize_cells
from rasterio.plot import show

df = pd.read_parquet(project_root / "data/population-841fa8bffffffff.parquet")
size = 1000
nodata_value = -1
array, transform = rasterize_cells(
    pa.array(df["h3index"]),
    pa.array(df["pop_general"].astype("int32")),
    size,
    nodata_value=nodata_value
)

show(array, cmap="viridis", transform=transform, contour=False)

<Axes: >